Futures Education Center
Equity Index Futures Spread Trading: A Different Way to Navigate the Market
Introduction: Two contracts, one strategy
Most traders approach the futures market one contract at a time — buy one, wait, sell one. But experienced futures traders understand there's a more nuanced approach that can reduce certain risks, lower margin requirements, and introduce a new dimension of market analysis: spread trading.
An equity index futures spread involves simultaneously buying one equity index futures contract and selling another — either a different contract month on the same index or contracts on two different but related equity indexes. Instead of anticipating whether the overall market will go up or down, a spread trader is making a relative value trade: focusing on how one contract will perform relative to the other. This subtle but important difference is key to understanding why spread trading has become a widely used strategy among institutional and sophisticated retail traders.
In this article, we'll explain the mechanics of equity index futures spreads, highlight their benefits, discuss their risks, and show you how TradeStation's FuturesPlus platform provides the tools to analyze, execute, and manage these trades effectively.
What is an equity index futures spread?
Before diving into strategy, it’s helpful to have a clear picture of the two primary types of equity index spreads.
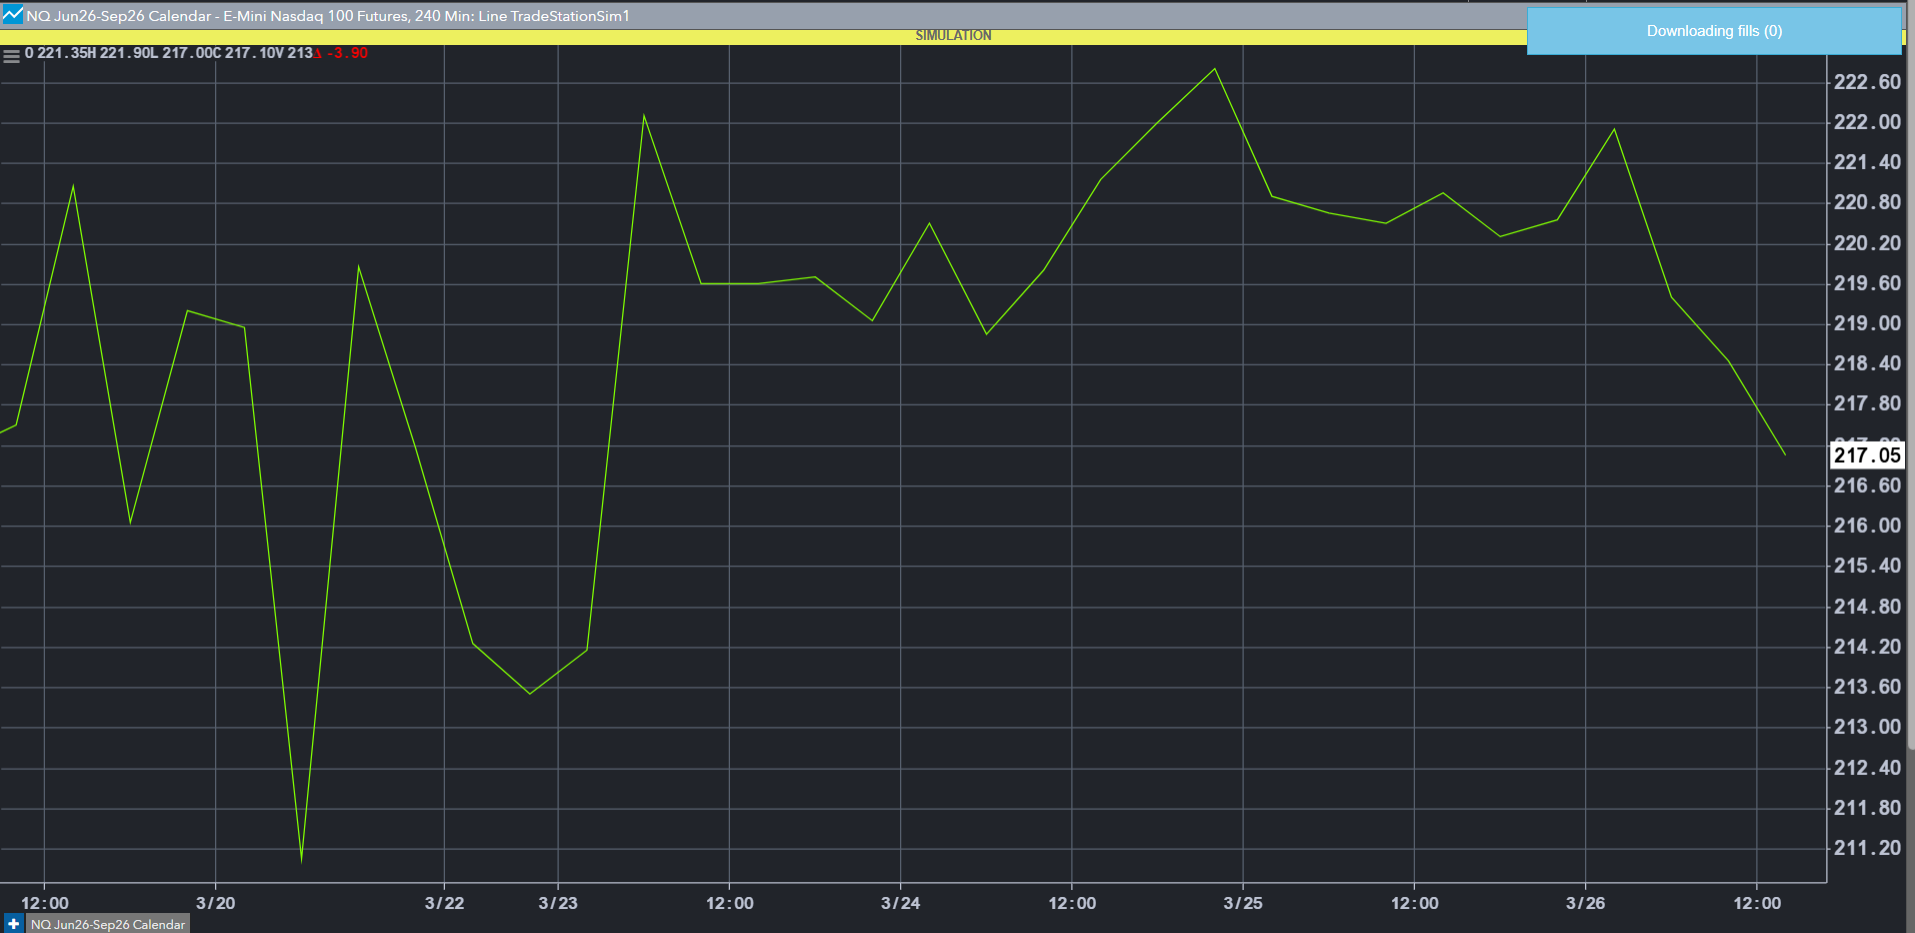
Calendar spreads involve buying and selling futures contracts on the same index but with different expiration months. For example, you might buy the June E-mini S&P 500 (ES) futures contract while simultaneously selling the September ES contract. You're not expressing a strong directional view on the S&P 500 itself — you're making a judgment about the pricing relationship between those two contract months, which is influenced by factors like interest rates, dividends, and the cost of carry.
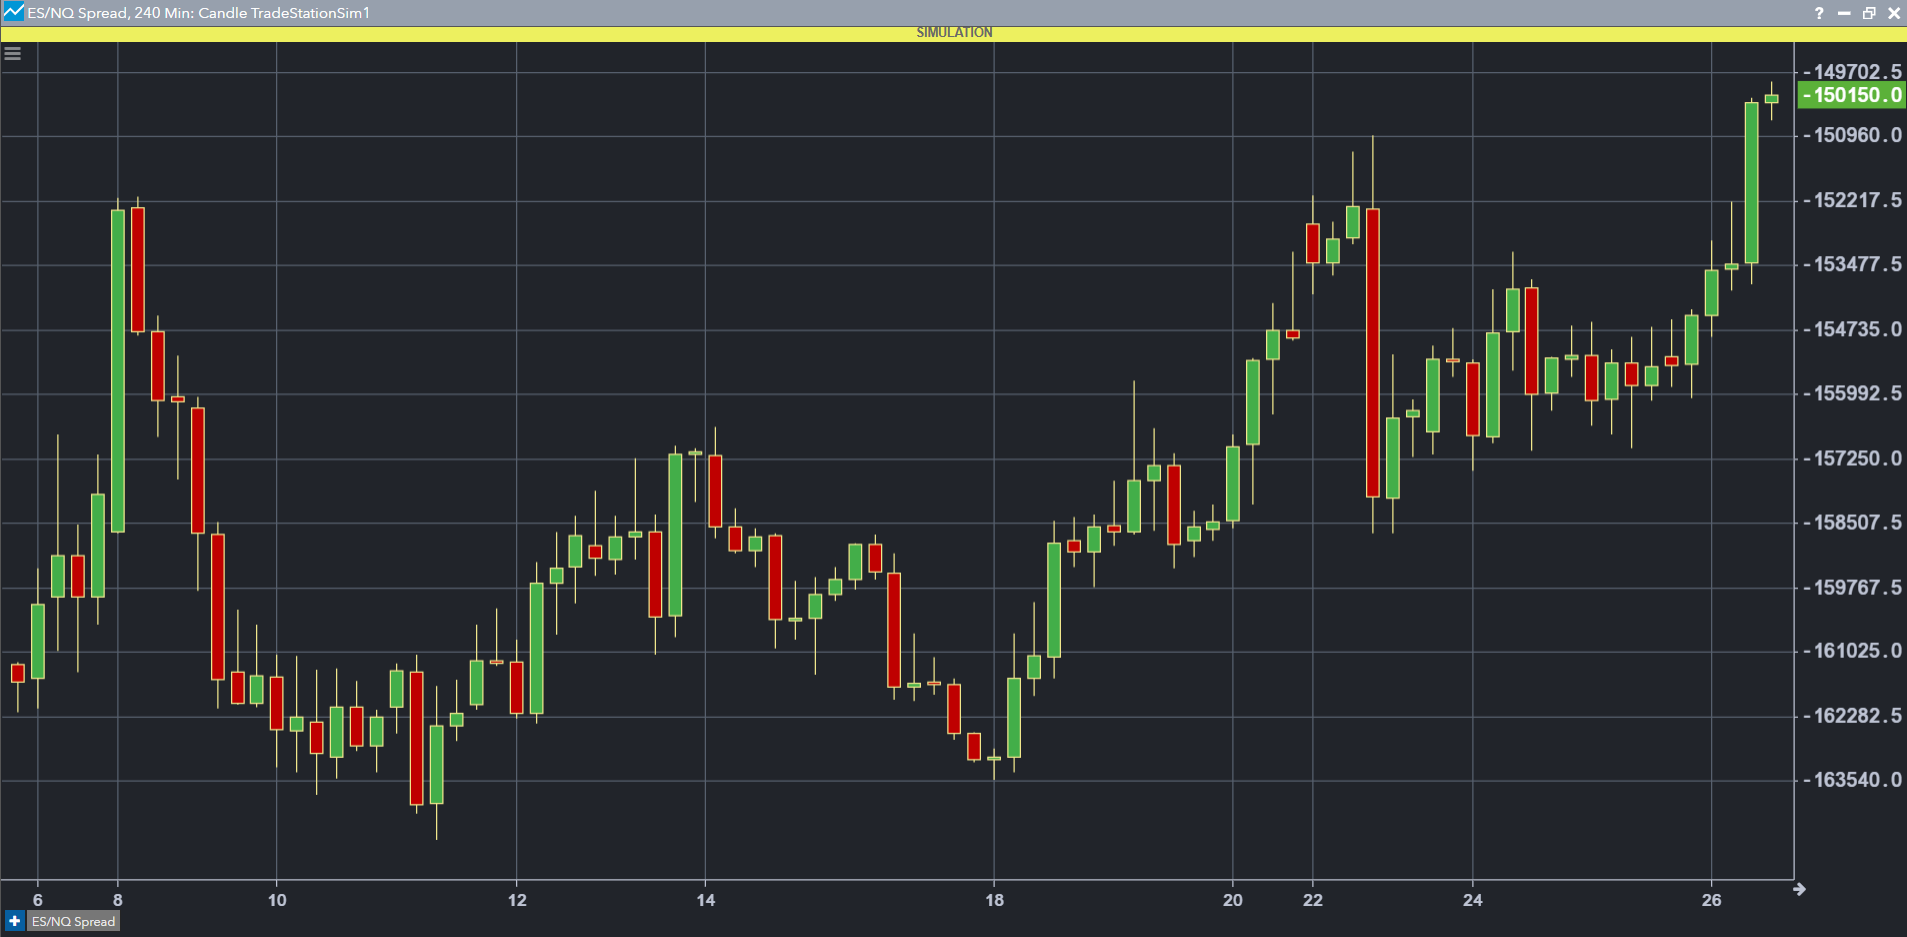
Inter-market spreads involve buying a futures contract on one equity index while selling a futures contract on a different but correlated index. A common example is going long E-mini S&P 500 (ES) futures while going short E-mini Nasdaq-100 (NQ) futures. This reflects a view on the relative performance of large-cap broad market stocks versus large-cap technology stocks. Other regularly traded pairings include ES vs. E-mini Dow (YM) or ES vs. E-mini Russell 2000 (RTY), which captures large-cap versus small-cap dynamics.
In both cases, the core logic remains the same: potential profit does not come from the overall market direction, but from the change in the price relationship between the two legs of the spread.
The benefits of spread trading
Potentially reduced directional risk
A potential advantage of a spread is that it reduces the overall market risk. If the broader market drops sharply due to a macro shock, both sides of your spread will probably move in the same direction — one up and one down relative to each other — but the sudden, large moves that can impact an outright futures position are partially mitigated. This doesn't mean spreads are risk-free, but it does mean the type of risk you're taking on is fundamentally different from holding an outright long or short position.
Think of it this way: an outright futures position is like standing in the middle of a river and trading on which way the current flows. A spread position is more like standing on one bank and speculating that your side of the river will rise faster than the other side after it rains. The flood waters may still get you, but you have a better chance of seeing it coming.
Lower margin requirements
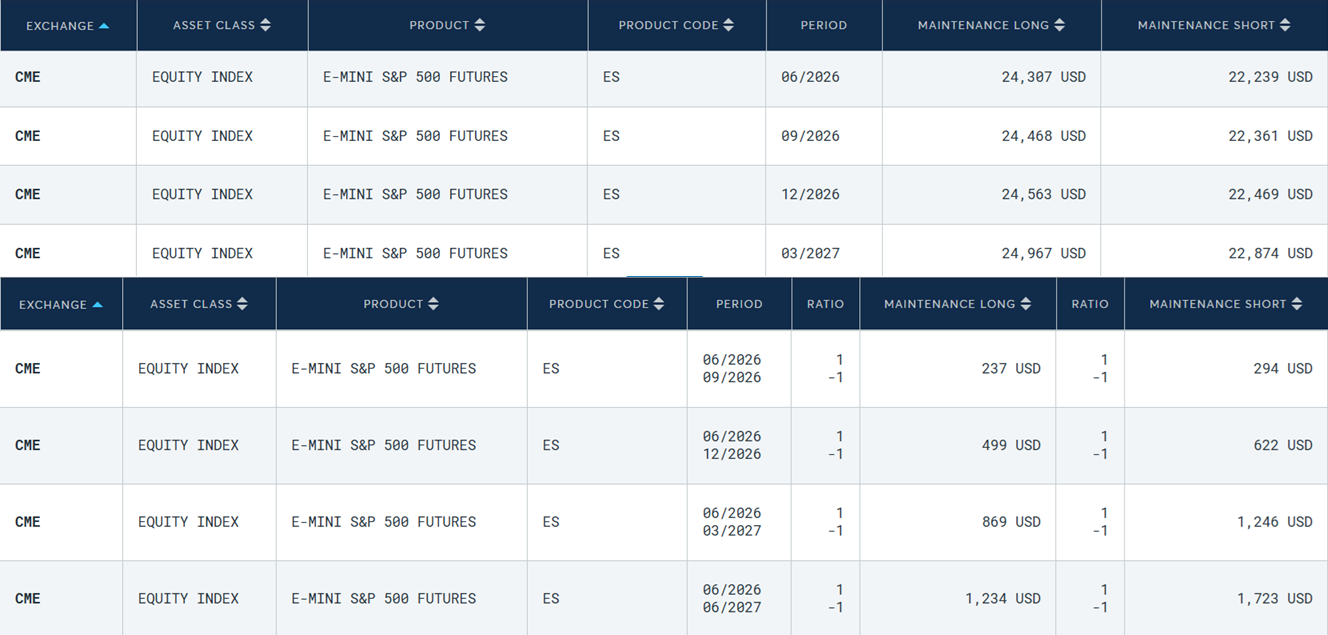
Because exchanges recognize that spread positions involve less directional risk than outright positions, they typically require less margin for recognized spread combinations. For example, the CME Group offers margin credits for intra-commodity calendar spreads on equity index futures. What might need approximately $24,000 in margin for an outright ES position could require less than $2,000 for an ES calendar spread, since the two offsetting legs hedge each other's risk according to the exchange's risk models.
Even the inter-market equity index futures spreads typically have lower margin requirements than individual directional positions. When properly ratioed, the offsetting legs also hedge each other's risk from the exchange’s perspective.
This capital efficiency provides a useful practical benefit. It allows you to implement more strategies with the same account size, potentially, or to retain more capital as a buffer against adverse moves. However, reduced margin requirements do not reduce the risk of loss.
Unique market intelligence
Beyond the tactical advantages, spreads can offer insightful information. For example, the relationship between ES and RTY futures acts as a real-time reference for investor sentiment toward large-cap stocks versus small-cap stocks — a typical risk-on/risk-off signal. When small-cap stocks lead large-caps higher, it often shows broad market confidence. On the other hand, when large caps outperform, it might suggest a flight to quality in equities. Keeping a close watch on these spread relationships can provide insights into the market's underlying health that you can't get from analyzing a single index.
Understanding correlation risk
Here's where we need to have an honest talk about a widely misunderstood risk in spread trading: correlation risk.
The main idea of a spread trade is that the two legs are generally related. In equity index spreads, indexes like ES and NQ have historically been highly correlated—they tend to move up and down together most of the time. This correlation helps keep the spread stable and allows for margin reduction.
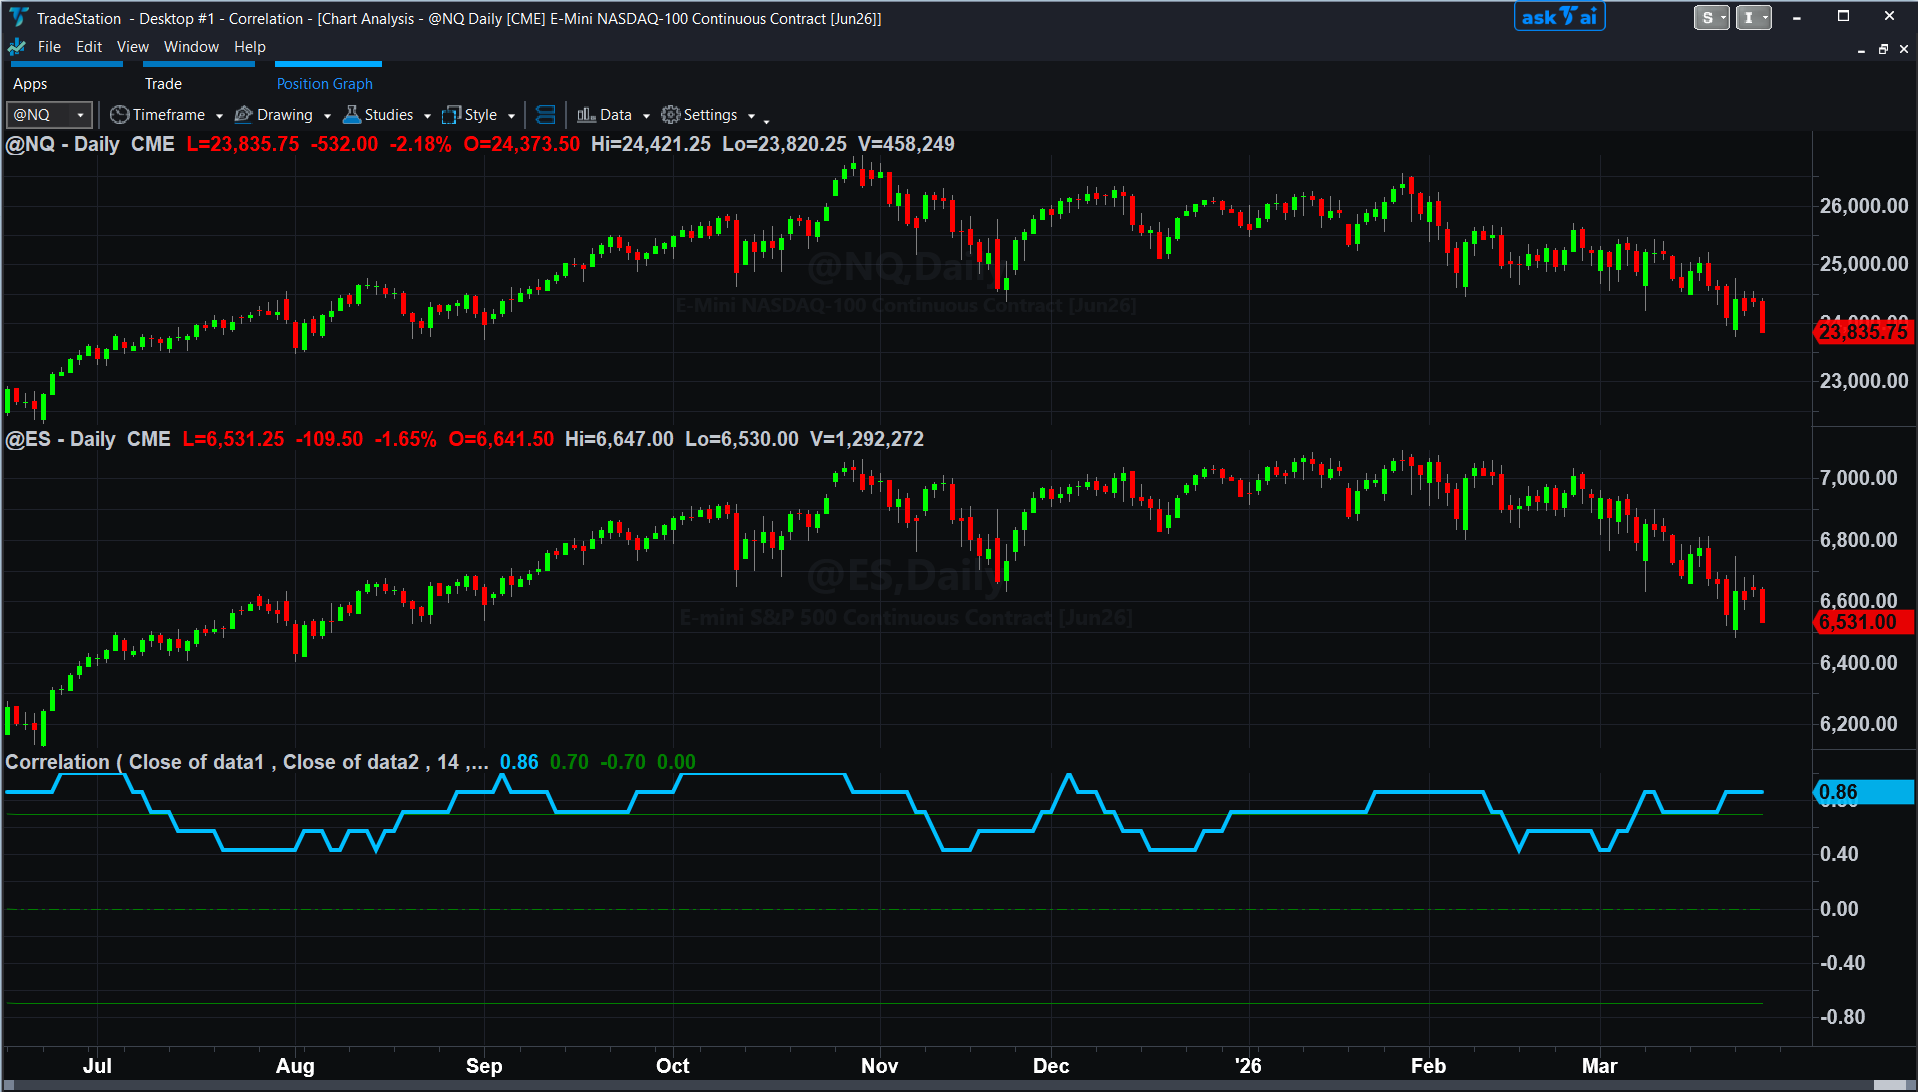
But correlation is not a constant. It is a statistical relationship that can shift, sometimes dramatically, under stress. During the COVID-19 market shock of early 2020, for instance, technology-heavy indexes briefly decoupled from broader market indexes as investors repriced the sector-specific outlook for technology companies. A trader who assumed that an ES/NQ spread would always behave predictably was in for a surprise.
The practical lesson is this: a spread isn't a complete hedge. It reduces some risks but concentrates others. You've exchanged directional risk for basis risk, the chance that the relationship between your two legs moves against you in an unexpected way. Important tip: Always understand what influences the spread you're trading, and watch how that relationship behaves across different market regimes, not just recent history.
Determining appropriate leverage and position sizing
Even with lower margin requirements, it's easy to over-leverage a spread position — and that's a trap many new traders may fall into. Just because you can buy more contracts doesn't mean you should.
A useful starting point for position sizing is to set your risk in dollar terms before deciding your contract quantity. Ask yourself: what is the maximum dollar loss I'm willing to accept on this trade if it goes completely wrong? Once you have that number, work backward from your stop level to determine how many contracts are suitable.
For equity index futures spreads, many traders find it helpful to think in terms of the spread value—the price difference between the two contract legs—rather than the notional value of each leg individually. If you're trading an ES versus NQ spread, the relevant price is how many points the spread has moved against you multiplied by the appropriate tick value, not the full notional exposure of two large index futures contracts.
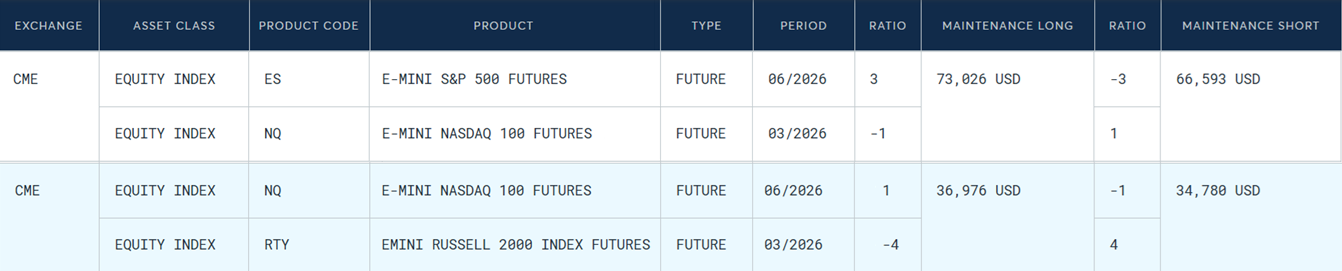
Because ES, NQ, YM, and RTY contracts have different point values ($50, $20, $5, and $50 per point, respectively, for the E-mini contracts), position sizing in inter-market spreads requires careful attention to the dollar value equivalence of each leg. Simply trading one contract against one contract often creates an imbalanced spread. Many experienced traders use a ratio or a DV01-style calculation to ensure that the two legs are approximately dollar-neutral before the trade is placed.
You can find the spread ratios for many inter-market equity index spreads on the CME Group website. The ratios are listed in the inter-market margins section.
A DV01-style calculation is a concept borrowed from fixed-income trading, where "DV01" stands for the Dollar Value of a 01 (one basis point). Applied to equity index spreads, the idea is straightforward: calculate the dollar sensitivity of each leg per unit move, then use that to determine a contract ratio that makes the two legs approximately dollar-equivalent. For example, if the S&P 500 is trading at 6,700, a 1% move equals roughly 67 points. At $50 per point, that's $3,350 per ES contract. If the Nasdaq-100 is at 25,000, a 1% move equals roughly 250 points — and at $20 per point, that's $5,000 per NQ contract. A simple 1-vs-1 spread is therefore not dollar-neutral; you have significantly more NQ exposure than ES exposure. Dividing $5,000 by $3,350 gives a ratio of approximately 1.49, meaning you'd want to trade roughly 6 ES contracts for every 4 NQ contracts to approach balance. This ratio should be recalculated periodically as index levels change.
TradeStation FuturesPlus Autospreader tool lets you build the inter-market equity index spreads in the ratio or balance you choose. Once you have created and named the spread, you can open a chart, MD Trader, or a Market Grid to analyze and trade the spread.
Entry and exit points: Reading the spread chart
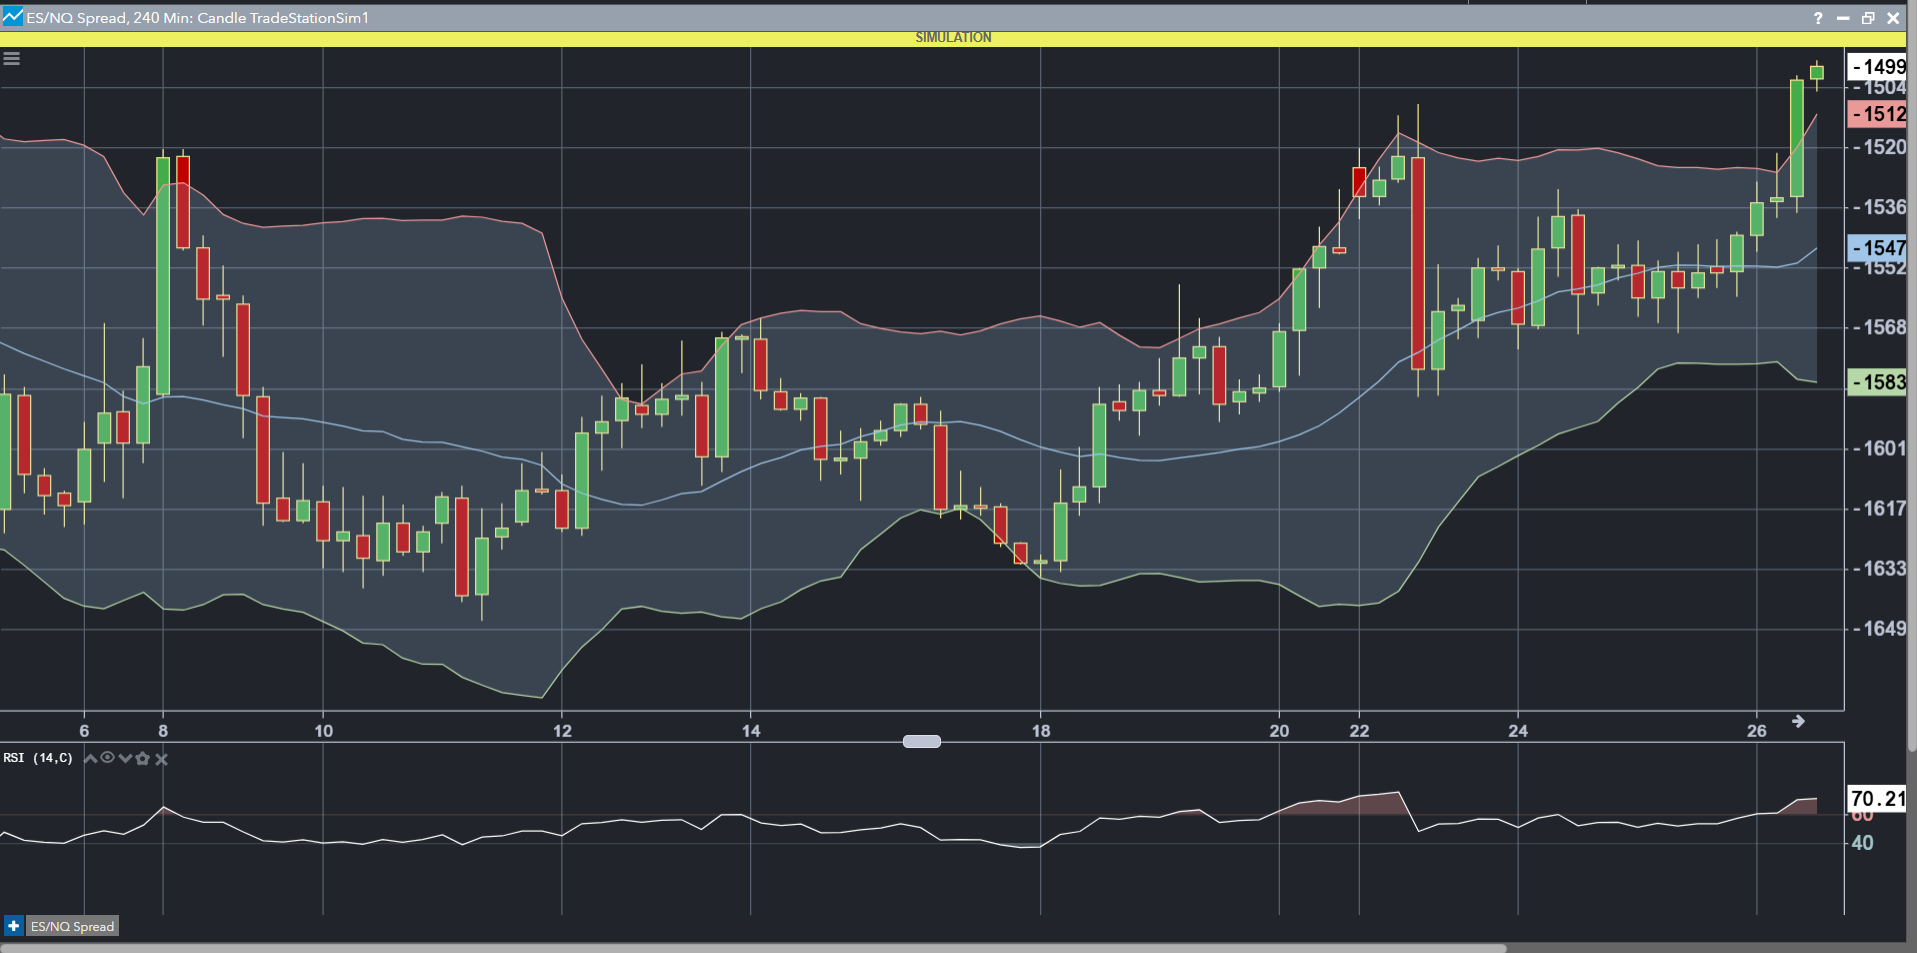
One of the key conceptual shifts when moving from outright to spread trading is that you are now analyzing a new instrument: the spread itself. Instead of charting ES or NQ alone, you analyze the price difference between the two legs. FuturesPlus lets you create and display spread charts directly so that you can use technical analysis — support and resistance levels, moving averages, momentum oscillators — on the spread relationship.
Entry signals in spread trading can stem from mean-reversion behavior. Since most equity index pairs are structurally connected, the spread typically trades within a historical range and may revert to its average over time. When the spread widens or narrows significantly beyond its usual range — possibly due to a short-term catalyst impacting one index more than the other — a spread trader looks for signs of reversion as a potential entry point.
That said, not all spread dislocations are mean-reverting. Sometimes a structural shift genuinely changes the relationship (think of the long-term divergence between the Nasdaq and the Dow in the years after the dot-com bubble burst and the tech sector re-emerged as a dominant economic force). Distinguishing between a temporary dislocation and a true regime change is a challenging and meaningful skill in spread trading.
For exit points, set a target level based on where you expect the spread to revert, and stay disciplined about taking profits. Spreads can oscillate repeatedly, and holding out for additional movement may give back gains.
Setting stops: Protecting against basis risk gone wrong
Because spreads are lower-volatility instruments, some traders may set stops too loosely or not at all, reasoning that the position is "hedged." This is dangerous thinking.
A spread can move quickly against you if one leg gaps unexpectedly — for example, if one index's futures are temporarily halted or if a sector-specific shock impacts one index much more than the other. Therefore, the stop placement on a spread trade should be based on the spread value chart, not on the individual legs.
Identify a level on the spread chart beyond which your thesis may no longer hold — maybe a level that has historically acted as strong support or resistance, or a statistical threshold like two standard deviations from the mean. Set your stop at that point. FuturesPlus allows you to enter spread orders as a single unit, and you can monitor the live spread value against your stop level directly on the platform.
Liquidity and execution risks
Equity index futures are among the most liquid futures contracts worldwide, which is a major benefit of trading spreads on these instruments compared to, for example, commodity futures. The ES, NQ, YM, and RTY markets all trade on the CME Globex electronic platform nearly 24 hours a day, five days a week, with high open interest and narrow bid-ask spreads.
However, liquidity in the spread is not always the same as liquidity in the individual legs. Calendar spreads on ES, for instance, have their own dedicated spread order book on Globex, and are generally quite liquid around roll periods. But some inter-market spread combinations — particularly those involving less liquid contracts or less popular index pairings — may have wider effective spreads and more slippage, especially during off-hours or periods of market stress.
Execution risk in spread trading mainly comes from leg risk — the chance that when you attempt a two-legged trade, one leg executes while the other does not, leaving you with an unintended outright position. To reduce this risk, it is often advisable to use native spread order functionality instead of placing two separate orders manually. TradeStation FuturesPlus supports native spread order entry, which sends the two-legged trade to the exchange as a single spread order, helping lower the risk of a partial fill that results in unintended exposure.
Practice before you trade live
No matter how well you understand the theory of spread trading, there is no substitute for doing it — watching how a spread moves tick by tick, experiencing the psychology of managing a two-legged position, and getting comfortable with the order entry workflow. And a highly practical way to build that experience without financial risk is through simulated trading.
TradeStation FuturesPlus offers a simulated trading mode that enables you to place, manage, and close spread trades in a fully realistic environment using live market data, all without risking real capital. Take this mode seriously — treat your simulated trades with the same discipline you'd use with real money. Track your entries, exits, and the reasoning behind each trade. Review your results and ask yourself whether your spread thesis is consistently sound, whether your position sizing is appropriate, and whether you are respecting your stops.
Only after demonstrating sustained discipline and performance in simulation — across a meaningful number of trades and different market conditions — should you consider moving to live trading. The markets will always be there. There's no benefit in rushing.
Conclusion: A more sophisticated approach to futures
Equity index futures spread trading marks a significant advance in trading sophistication. By emphasizing relative value instead of outright direction, spread traders benefit from lower directional exposure, better margin efficiency, and a deeper understanding of market dynamics. However, these benefits come with their own set of risks — such as correlation breakdown, basis risk, leg execution issues, and the temptation to over-leverage — all of which require respect and careful management.
Successful traders in spreads are those who take the time to understand the instruments they're trading, size their positions carefully, set and stick to their stops, and use top-quality tools to analyze and implement their ideas. TradeStation FuturesPlus is built to support this disciplined, informed approach.
Begin with simulation. Master the mechanics. Develop your understanding. Build your discipline. Then decide if live trading is right for you.
Important Information and Disclosures
Futures trading is not suitable for all investors. To obtain a copy of the futures risk disclosure statement visit www.TradeStation.com/DisclosureFutures.
Margin trading involves risks, and it is important that you fully understand those risks before trading on margin. The Margin Disclosure Statement outlines many of those risks, including that you can lose more funds than you deposit in your margin account; your brokerage firm can force the sale of securities in your account; your brokerage firm can sell your securities without contacting you; and you are not entitled to an extension of time on a margin call. Review the Margin Disclosure Statement at www.TradeStation.com/DisclosureMargin.
Any examples or illustrations provided are hypothetical in nature and do not reflect results actually achieved and do not account for fees, expenses, or other important considerations. These types of examples are provided to illustrate mathematical principles and not meant to predict or project the performance of a specific investment or investment strategy. Accordingly, this information should not be relied upon when making an investment decision.
This content is for educational and informational purposes only. Any symbols, financial instruments, or trading strategies discussed are for demonstration purposes only and are not research or recommendations. TradeStation companies do not provide legal, tax, or investment advice.
ID552515 D0526
